A century of cortical cartography has helped neurologists understand how the human brain perceives and interprets our complex surroundings.

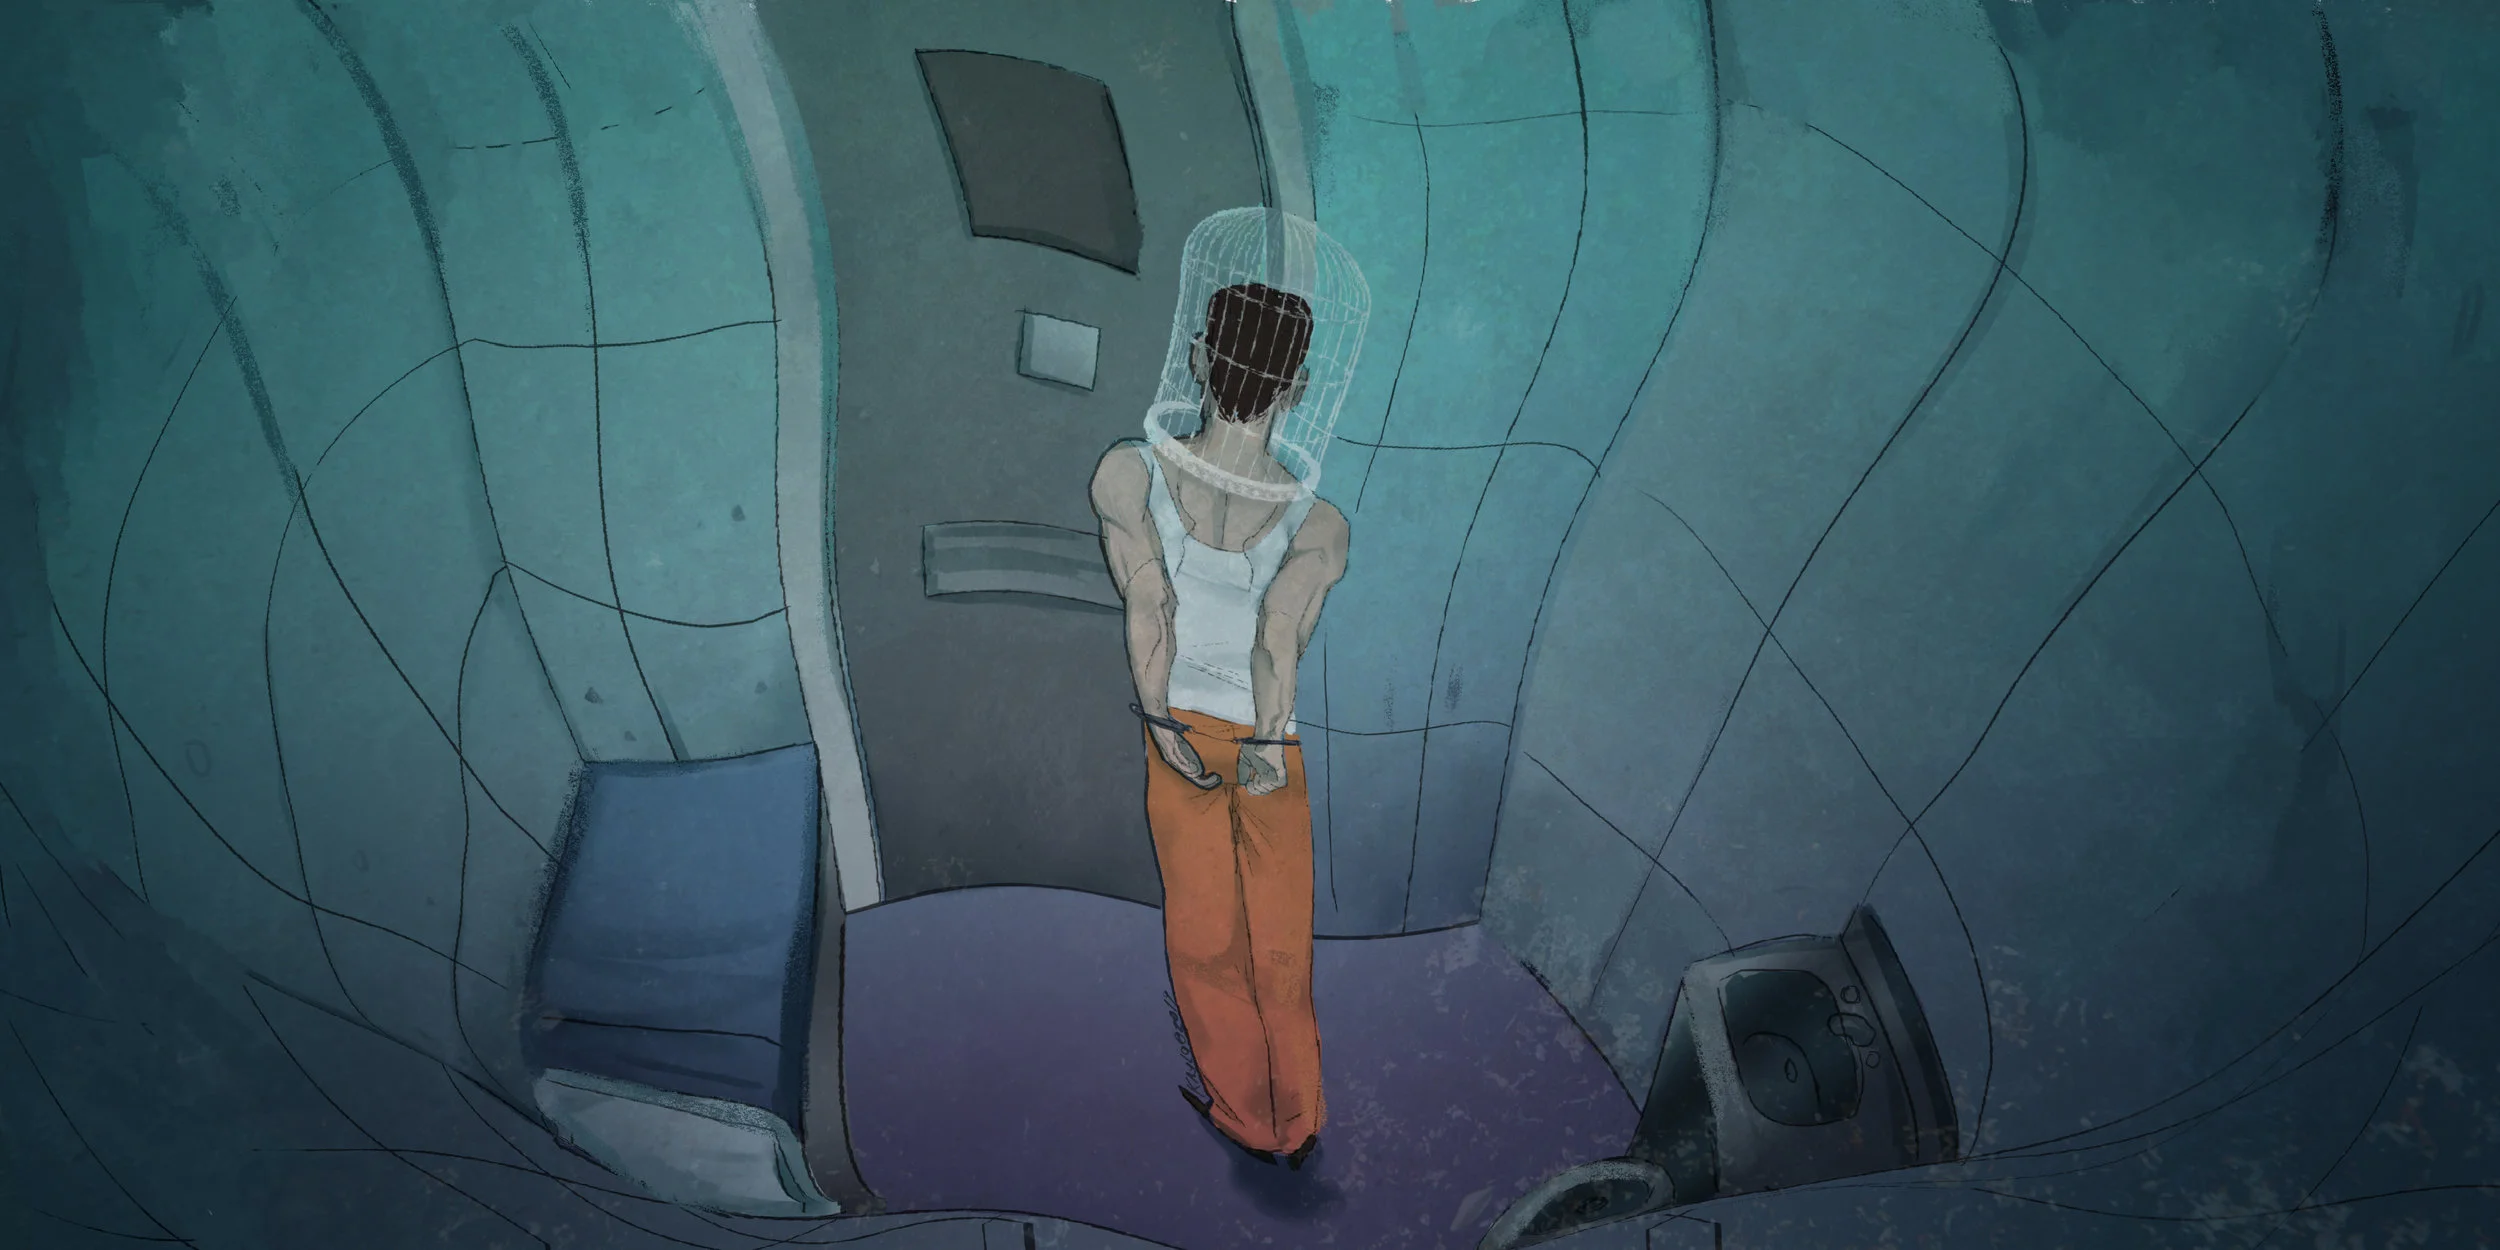
Illustration by Simona Seizova
Real estate is expensive in the brain. So, like the architects of Manhattan high-rises, the human brain has learnt to make efficient use of limited space by building in a third dimension. Rather than remaining a smooth, flat sheet of cells, as in some of our ancestors, the human brain has grooves and folds. This organic origami allows more neurons to be packed into the limited space within a skull.
But, as with any densely-packed city, commutes can be brutal. Optimised for long-distance communication, glistening white fibre tracts act as the highways, connecting different brain areas. The arrangement of neurons within a brain area, however, develops to make local communication efficient. Neurons use their activity to represent information, and, within a brain area, nearby neurons represent nearby things: nearby parts of the body, nearby areas in visual space, or nearby spatial locations in the world. In this way, the brain is like an atlas. It contains many maps — of the body, of the visual world, of the space we inhabit. A relationship between the abstract information a neuron represents and its physical location is not required for brain function. But cells that represent similar information will want to talk to each other, and putting them close together saves on communication costs.

English neurologist John Hughlings Jackson, best known for his early research on epilepsy, helped establish our understanding of how different body parts and functions are ordered within the brain. Lance Calkin/Wikimedia Commons (public domain)
While evolution found its way to these maps long ago, only recently have scientists come to identify them. When John Hughlings Jackson, a neurologist in the latter half of the 19th century, began to suspect that motor control had a clear map-like organisation in the cerebral cortex, it was thoroughly against contemporary scientific thought. At the time, the idea that different areas of the cortex are specialised for different functions hadn’t even been established, let alone how those areas are internally arranged.
Limited by the lack of neural recording technology at the time, Jackson’s clever cartography involved careful observation of how seizures spread through the body of his epileptic patients. For example, seizures that started in the face moved down the arm, or they started in the leg and moved upward. They never skipped over or jumped between different body areas, but marched orderly through them. Jackson concluded that the body must be represented in a very particular order in the cortex. Jackson’s hunch was eventually confirmed directly when it was shown that electrically stimulating different parts of the motor cortex led to movement in different body parts. His method of discovery is even echoed in the modern study of phantom limb syndrome, where clinicians have noticed that movement of the face can elicit phantom pain in an amputated arm, due to the proximity of the arm and face representations in the brain.
Maps of territories are built up, and details are added, as a function of their use: Rural areas have sparing features, while every step of a city may be drawn in with detail. The brain is no different. In the motor cortex, the amount of cortical space dedicated to a body part is not determined by its size, but rather by its usage. Relatively small but extremely useful bits of our body, like our hands, are allotted many neurons to control them, while the upper arm only gets a sliver of space. Neuroscientists have come to depict this information as a ‘cortical homunculus’: a representation of the body where the size of each part is proportional to its size in the cortical representation. These figures can be shocking to look at it, with their skinny limbs and giant lips and hands. These grotesque characters, used to visually depict how the brain represents the body, are essentially maps of maps. And they stand as reminders that the brain is under no obligation to represent things as they are, but only as they are useful to the brain.

This homunculus shows the relative proportions of the brain used for sensory processing for different body parts. Note the large portions of the brain dedicated to the hands and face. Mpj29/Wikimedia Commons (CC BY 4.0)
The discovery of these somatic representations established that the brain can contain maps. But it took war — and the damage from new weaponry designed for it — to show this representation style was more the rule than an exception. In 1905, during the Russo-Japanese War, Japanese ophthalmologist Tatsuji Inouye was assigned the job of inspecting returning soldiers’ injuries, to determine what pension they were owed. He used this access to multiple cases of head injuries to investigate the effect of lesions in different areas. By observing patterns of selective blindness, he concluded that the brain represents visual space in an organised, though perhaps counterintuitive, way. The lower half of the visual world is cast onto the upper half of the visual cortex, and vice versa, with a deep groove called the calcarine fissure splitting the two halves. Furthermore, the left and right visual worlds are also switched, with the right side of the visual field represented in the left hemisphere.

Research by British neurologist Gordon Holmes further supported the findings of Tatsuji Inouye. Wellcome Images/Wikimedia Commons (CC BY 4.0)
As with the brain’s map of the body, more important areas are allotted more space. The majority of visual cortex is dedicated to central vision, only processing information that comes from a small point at the centre of our retinas. Inouye’s findings were further supported during World War I by British neurologist Gordon Holmes, who saw many soldiers with lesions in visual areas — perhaps due to how high British helmets sat on the head, leaving the occipital lobe at the base of the brain exposed.
Decades of research has now verified that individual neurons in the visual cortex respond only to particular areas of visual space, and that, collectively, these neurons form a map of visual space, a process called “retinotopy.”
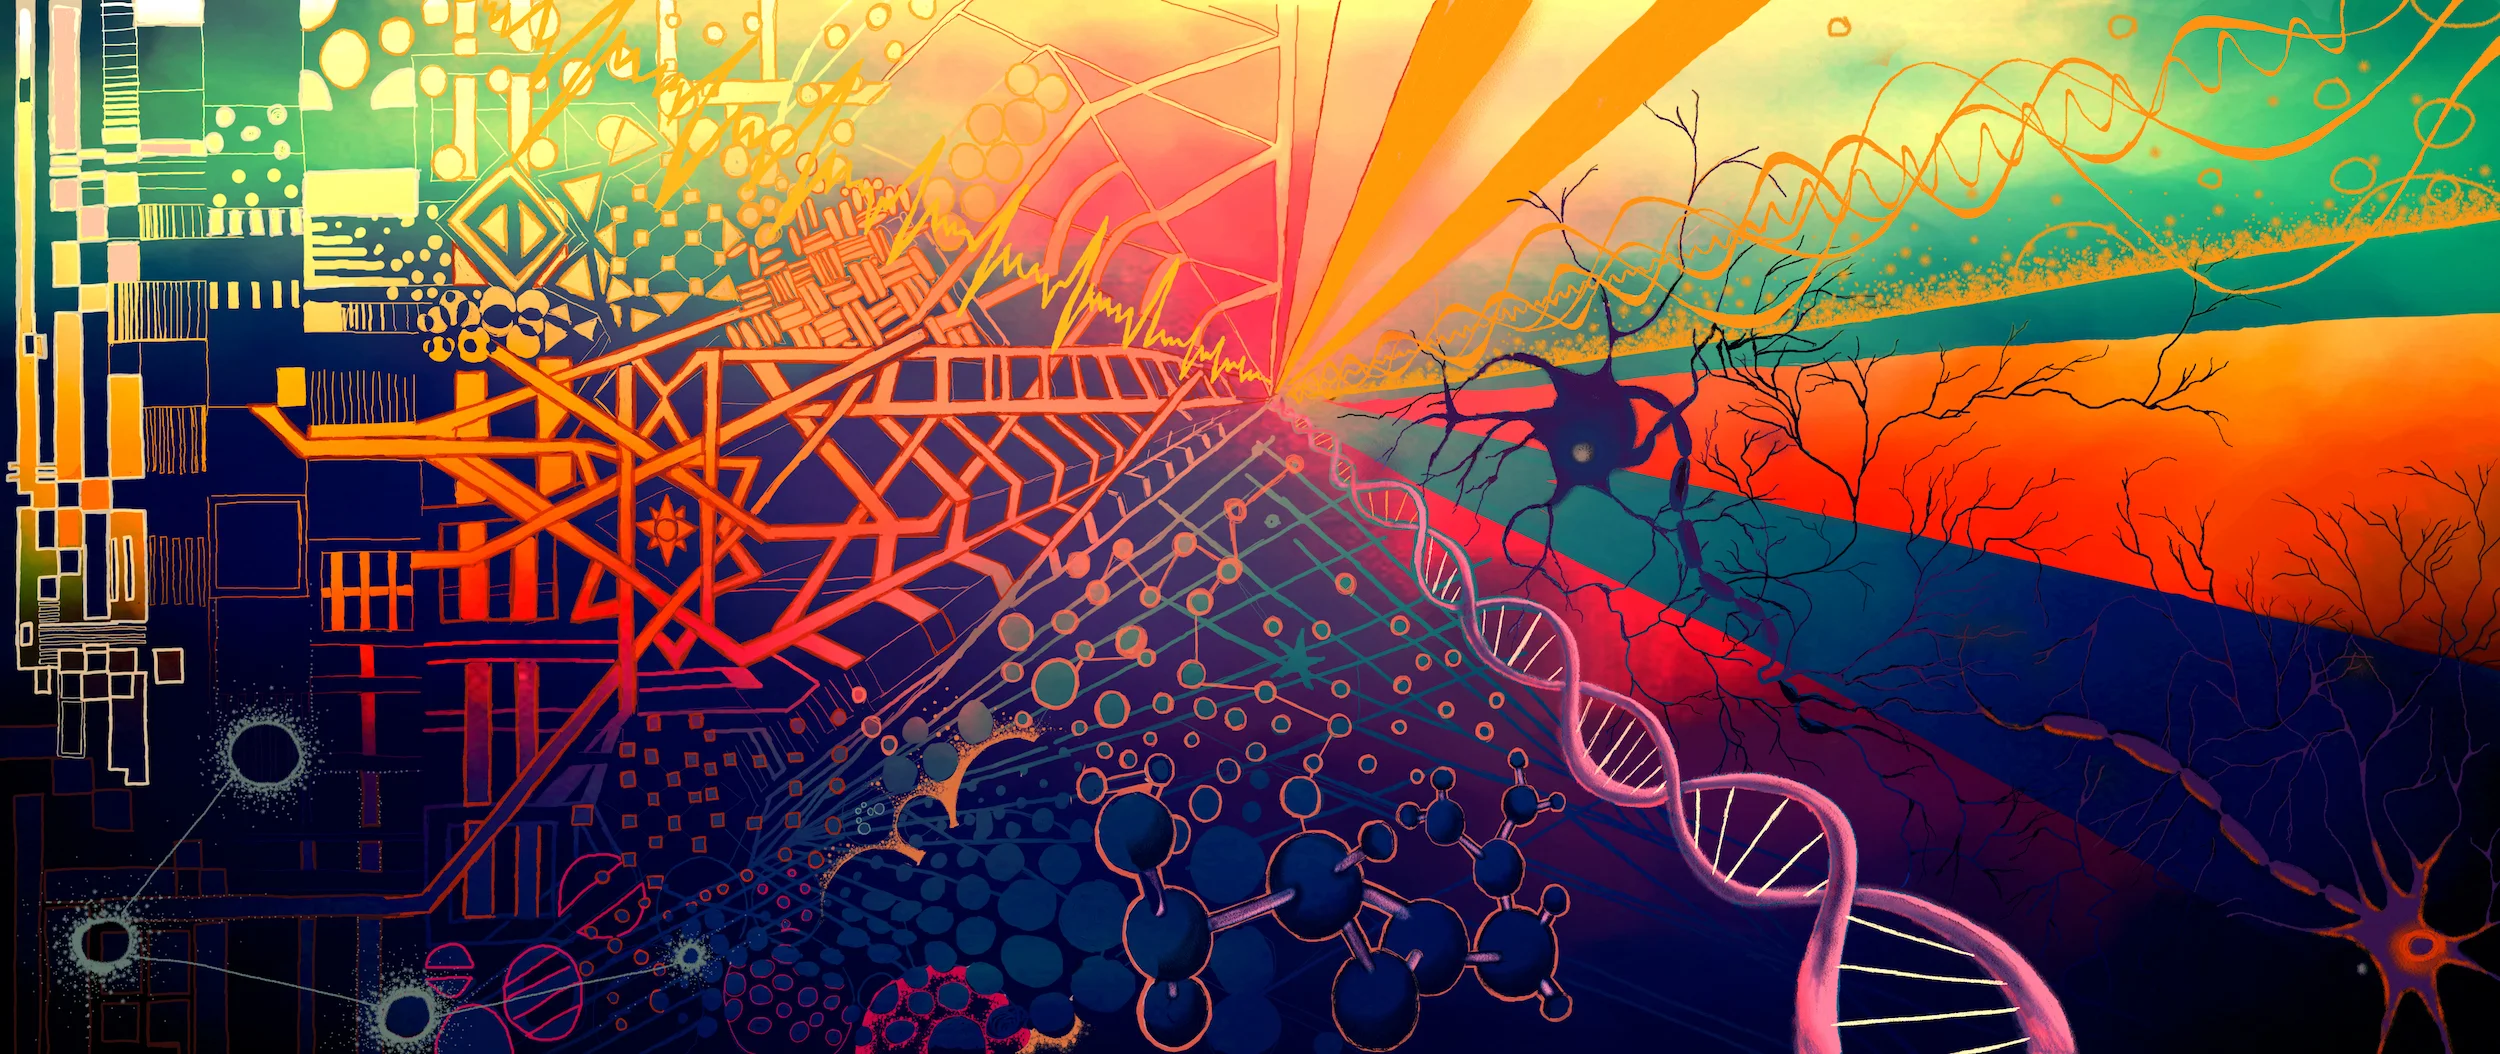
But within this map is another map, which emerges because neurons don’t respond identically to just anything in their preferred visual space, but have preferred patterns, as well. In the early stages of visual processing, these patterns correspond to different orientations: Some neurons are active when a horizontal line is present, others are active in response to vertical lines, and so on. At each spatial location on the cortex, neurons that prefer similar orientations are physically near each other. If each neuron were coloured according to its preferred orientation, a patch of visual cortex would look like a rainbow swirl: Groups of cells that prefer, for example, vertical lines (represented by green) would seamlessly connect to a group that prefers lines tilted slightly off vertical (represented by blue), and so on. Where orientations of all types meet, a pinwheel is formed. Like the Four Corners Monument at the intersection of Utah, Colorado, New Mexico, and Arizona, these points on the cortical map represent the convergence of different territories.
With these orientation maps, the brain creates a spatial representation for information that isn’t itself spatial in nature. This, too, is a common type of mapping in the brain. For example, in the cochlea (a small snail-shaped structure inside the ear), sounds become spatially-segregated according to frequency. High-frequency sounds activate cells at one end of the cochlea, and low-frequency sounds activate cells at the opposite end. This initial physical separation of tones creates a “tonotopy” that is present throughout the auditory system.
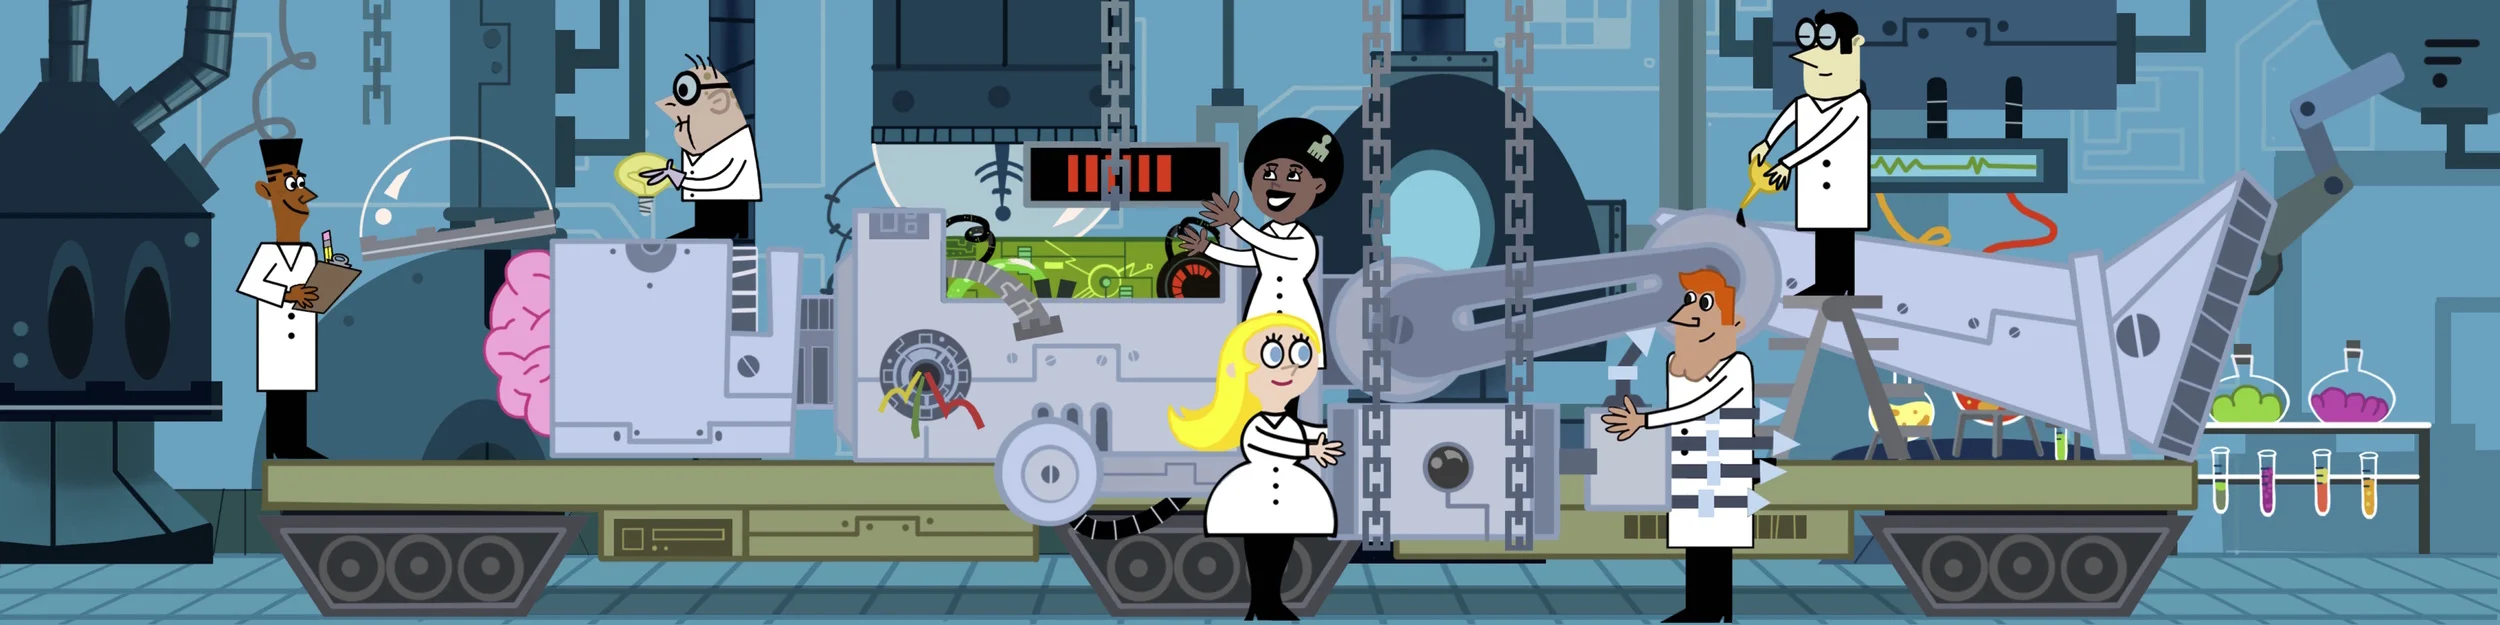
Finding the outside world depicted in such ways throughout the brain suggests a role for maps that may go beyond pure efficiency of connectivity. Indeed, so striking and common is the presence of maps that computer scientists were inspired to explore the possible computational role this organisation plays. In 1982, Teuvo Kohonen introduced the concept of self-organising maps, an algorithm that provides a simpler way of representing complex and diverse information, by collapsing it into two dimensions. The taste of wine, for example, may be described only in terms of sweetness and acidity, ignoring subtler notes and flavors. In devising this new representation, the algorithm identifies the most relevant features of the data. The brain’s maps may thus be viewed as the visible marker of a much deeper computational process — one that seeks to identify and represent the most relevant features of incoming information.

Artificial neural networks are inspired by the biological networks in our own brains, and can solve complex problems in a similar way. Akritasa/Wikimedia Commons (CC BY 4.0)
But what happens when the information coming in has no obvious condensed form, no easy topography or natural definition of “nearby”? This is the situation in which neuroscientists have found themselves when it comes to the study of smell. Small changes in the molecular makeup of an odour molecule can have significant effects on its perception, turning a pleasant brown sugar into rancid butter. Should the brain then map out odours by their shape or by their smell, or some combination thereof? Answers to these questions have not been found by looking at the brain areas responsible for olfaction, as they have no obvious organisation. Scientific thinking at present suggests that the information we need to extract from odours is too diverse to expect any single mapping of them in the brain. So, for now, the space of smells remains uncharted.
Even when a simple map-like representation is possible, it’s not always found. The swirls of orientation preference described above are present in some animals, such as cats and primates, but absent in others, such as rodents, for which a neuron’s preferred orientation has no relation to that of its neighbours. And in turtles, retinotopy has even been abandoned. The reasons for these differences, and any impacts they may have on visual function, are unclear.
But here we can see the exception proving the rule: The absence of maps is notable only because maps are so expected. An interpretable spatial layout of neurons is so common — and so immediately recognisable to us when it occurs — that disorder is shocking. In this way, the map metaphor has emerged as a crucial guide in this scientific journey, leading neuroscientists through their exploration of the brain.
Edited by Andrew Katsis and Duncan Bell


